


|
|
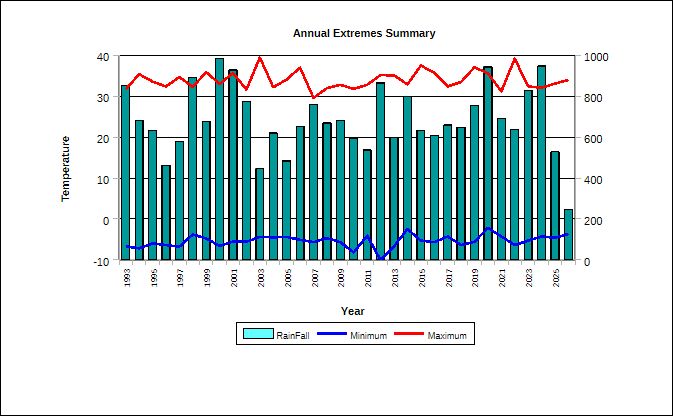
Temperature (C) |
Rainfall (mm) |
Wind (mph) |
|
|
Minimum |
Maximum |
Total |
Max.. Gust |
|
|
1993 |
- |
31.7 |
852 |
|
|
1994 |
- |
35.4 |
682 |
44 |
|
1995 |
- |
33.6 |
631 |
56 |
|
1996 |
- |
32.4 |
463 |
46 |
|
1997 |
- |
34.7 |
580 |
52 |
|
1998 |
- |
32.3 |
891 |
80 |
|
1999 |
- |
35.9 |
676 |
73 |
|
2000 |
- |
33.0 |
985 |
113 |
|
2001 |
- |
35.7 |
929 |
83 |
|
2002 |
- |
31.6 |
775 |
102 |
|
2003 |
- |
39.5 |
458 |
34 |
|
2004 |
- |
32.2 |
597 |
53 |
|
2005 |
- |
34.1 |
517 |
46 |
|
2006 |
- |
37.0 |
653 |
33 |
|
2007 |
- |
29.6 |
759 |
40 |
|
2008 |
- |
32.0 |
669 |
35 |
|
2009 |
- |
32.8 |
726 |
36 |
|
2010 |
- |
31.8 |
594 |
30 |
|
2011 |
- |
32.8 |
537 |
37 |
|
2012 |
- |
35.2 |
865 |
13 |
|
2013 |
- |
35.1 |
600 |
15 |
|
2014 |
- |
32.9 |
799 |
17 |
|
2015 |
- |
37.5 |
634 |
14 |
|
2016 |
- |
35.8 |
607 |
32 |
|
2017 |
- |
32.4 |
660 |
42 |
|
2018 |
- |
33.5 |
648 |
39 |
|
2019 |
- |
37.1 |
755 |
36 |
|
2020 |
- |
35.9 |
943 |
43 |
|
2021 |
- |
31.2 |
693 |
45 |
|
2022 |
- |
39.2 |
639 |
42 |
|
2023 |
- |
31.1 |
829 |
36 |
|
2024 |
- |
32.1 |
947 |
41 |
|
2025 |
- |
33.1 |
528 |
37 |
|
2026 |
- |
34 |
247 |
40 |